Why do we need a Rubric View?
One of the features that is used frequently by our customers is the ability to create rubrics to give rich and specific feedback on learning standards or objectives and other criteria for student assignment submissions and other offline assessments (project work, presentations, etc.)
While the rubric creates a good scaffold for the feedback process, assessment performance on Teamie has typically only been measured through the numeric score that teachers give for the assessment, which may or may not be determined directly from the achievement of the scales on the different rubric criteria.
This is not a bad place to be, as teachers are still able to provide rich feedback to students, align learning standards with the assessments, and make the criteria available and visible to students as they work on the assessments. However, when it comes to report writing or reflecting on student or class performance, the numerical analysis only showcases the overall top/bottom achievers, but doesn’t highlight which learning objectives or criteria that specific students did well in, or where the class as a group didn’t perform well. To get a level deeper and make that insight easier to read and understand, we have introduced a new view in the Gradebook called the “Rubric View”.
What is the Rubric View?
The Rubric View shows the scale that each student has achieved on each of the rubric criteria for all the assessments in that class. For assessments with no rubrics, just the numerical score would be shown. The rubric criteria are grouped by the assessments that they were mapped to, and the same rubric criteria could show up in multiple assessments as different columns.
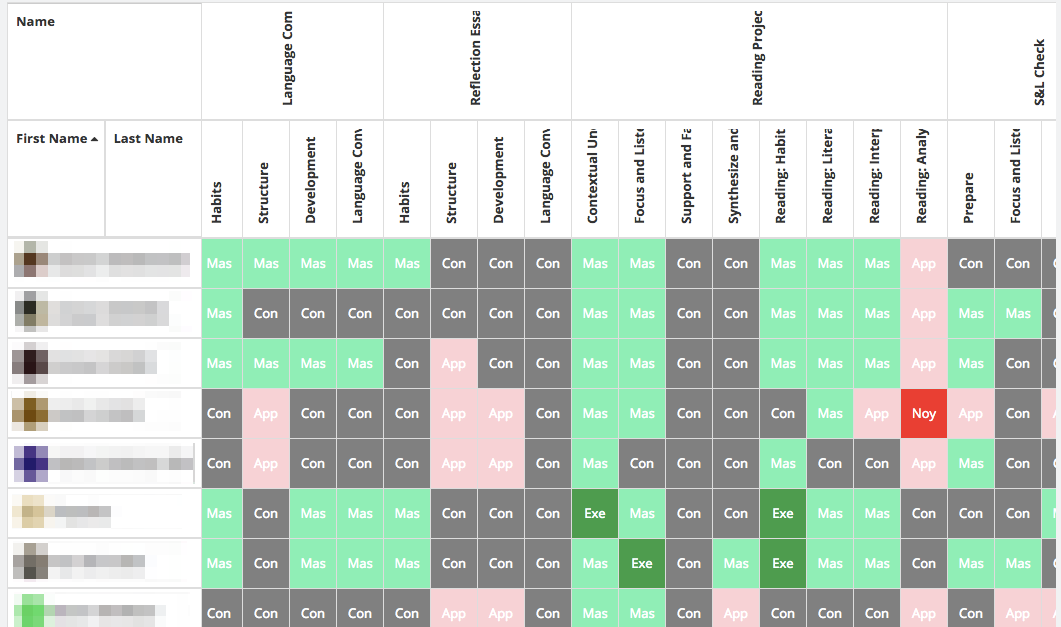
This is another way to look at the gradebook data, where the focus is more on students’ achievement and performance on rubric criteria or learning standards aligned with the assessments, rather than the overall score achieved for the assessment.
How to access the Rubric View?
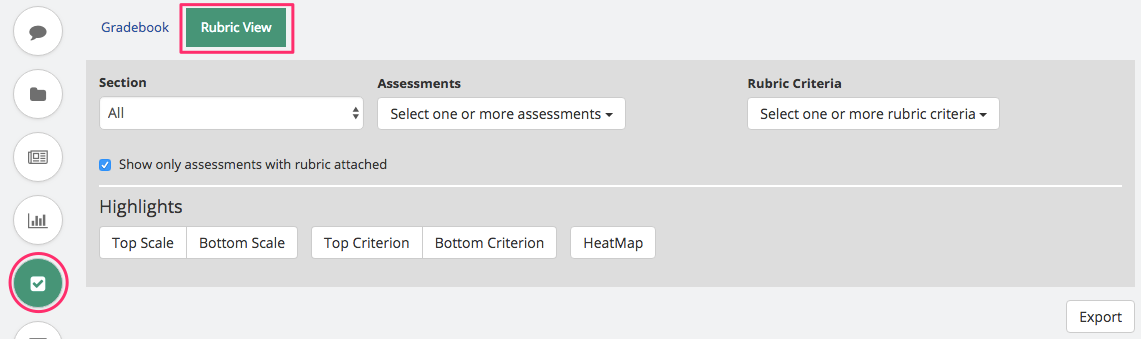
The Rubric View is an additional tab on the Gradebook page of your class on Teamie.
Filters & Highlights
The Rubric View allows you to filter specific assessments or specific rubric criteria to get a more focused view of the performance of the students. These criteria or assessments may belong to a single unit of learning, or may form a learning strand and hence analysing the student performance for those sets of criteria likely will reveal a deeper understanding of student performance.
Given that the amount of data can be a bit overwhelming to process easily, we have introduced 3 highlight tools:
- Top/Bottom Scale – Highlights which students have received the top or bottom scale for that criterion i.e. lowest or highest scale achieved in a column.
- Top/Bottom Criterion – Highlights the rubric criteria where at least 25% of the class has achieved the top/bottom scale, or at least 50% of the class has achieved the top/bottom 2 scales. The idea is to quickly identify criteria that are best/worst performing for the class.
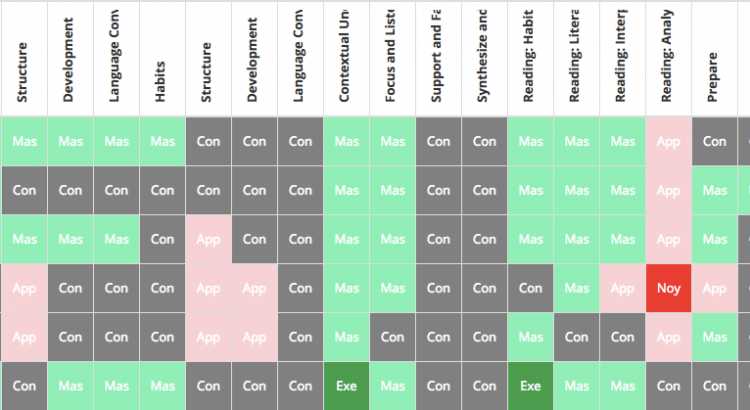
- HeatMap – Highlights all cells in shades of red to green based on the achievement of the scales for each criteria. This allows for a visual comparison of performance for a student across criteria, or of all students in a particular criterion.
Quick Edit
Teachers use their professional judgement to assess the level of achievement or mastery that a student has showcased based on the assessment evidence. This judgement may become more informed as more student submissions come in, and the teacher gets a better understanding of the performance of the class.
Once teachers can visually see the performance of students across the criteria and learning standards, they may want to adjust the levels/scale that certain students have achieved for some specific criteria.

Instead of having to go to each individual assessment, and then open up the submission to edit the rubric, teachers can do a quick edit of the scale achieved for a specific student for a specific criteria from the Rubric View itself. Simply click on the cell to view or change the rubric scale achievement!
Export
All these highlights are great, but some teachers are Excel Ninjas and want to be able to export the data and then work some Excel magic for further analysis. Don’t worry, as with all the other reports on Teamie, you can export the Rubric View, which gives you an Excel file with the data of the view.
What’s Next?
The Rubric View was built based on the feedback from teachers who were already doing similar heat map style analysis on their own and shared it with us as part of their wish list of things they would love to see on Teamie. I am thankful they shared their best practices in understanding student performance with us, and we can now make that available to all teachers using our platform.
Your feedback is critical to us, and is one of the key determinants of our product roadmap and priorities. We would love to hear from you on how we can enhance this view further, to make it more meaningful and useful for teachers to get deeper insights about student learning performance, beyond just the numbers. Write to us at support@theteamie.com or give us a shout out on Twitter.